The global stock market is a big place and it extends far beyond the borders of the United States.
While the US market is undeniably the largest and often sets the pace for others, it’s revealing to step back and consider the global scene occasionally. This broader perspective can alert investors to significant shifts in stock market rotations worldwide, particularly when the US market has marched off on its own.
Current International Rotations
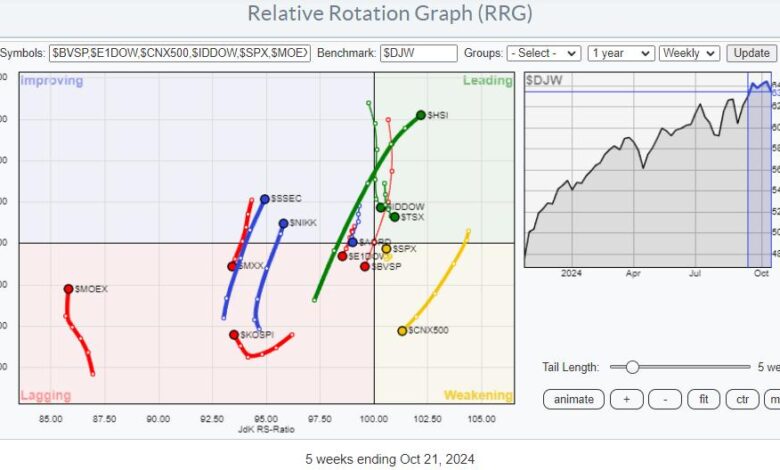
The Relative Rotation Graph (RRG) for international markets above plots several international stock market indices and benchmarks them against the Dow Jones Global Index ($DJW).
The S&P 500 (dollar SPX) is positioned very close to the center of the chart, hugging the benchmark. This proximity is expected, given that the US constitutes a hefty portion of the Dow Jones Global Index.
However, the S&P 500 is also depicted with a short tail within the weakening quadrant, indicating a renewed up-move within the already rising relative trend.
Asian Markets Are Strong
Shifting our focus from the US, we observe several well-defined and robust relative trends in other markets. The Hang Seng Index ($HSI) in Hong Kong stands out with its tail moving from the lagging quadrant through improving and into the leading quadrant over the last five weeks.
This is the longest tail on the RRG, suggesting a powerful move with a positive RRG heading and the highest RS momentum and ratio readings.
Other markets showing positive trends include China ($SSEC) and Japan ($NIKK), both of which have transitioned from the lagging to the improving quadrant. This shift indicates a relative strength and momentum pickup, hinting at likely outperformance in the coming weeks.
Conversely, the Russian ($MOEX) and Korean ($KOSPI) stock market indices are picking up relative momentum but remain within the lagging quadrant, continuing to underperform.
Where is the Money Flowing?
If we assume that global stock market money migrates to the most promising locations, we will notice outflows from certain markets.
For instance, India’s CNX 500 has seen its tail move from the leading quadrant through weakening. It is rapidly approaching the lagging quadrant, signaling a shift to underperformance, particularly against the Asian markets and the S&P 500.
Several markets, including the Australian All Ordinaries Index ($AORD), the DJ Europe index ($E1DOW), the Brazilian Bovespa index ($BVSP), and the Mexican Bolsa Index ($MXX) exhibit negative headings closer to the benchmark. The Brazilian market, in particular, shows a long tail crossing into the lagging quadrant. At the same time, the Mexican Bolsa completed a rotation of lagging-improving-lagging at very low RS-ratio levels. This makes it one of the weaker and more dangerous markets from a relative perspective.
Hang Seng Index vs. Indian CNX 500
The Hang Seng Index and the Indian CNX 500 present contrasting trends.
After a prolonged decline, the $HSI has formed a broad trading range and is currently testing a significant resistance level. A break above this resistance could signal substantial upside potential, with relative strength indicators suggesting a bottoming out and a potential shift in trend.
In contrast, the Nifty 500 index in India has completed a topish formation, with relative strength trending downward. This points to further underperformance and a negative price trajectory for the Indian market.
Zooming in on the daily chart of the Nifty 500 shows that an H&S top formation has just completed, signalling weakness not only from a relative perspective but also in terms of price.
S&P 500 vs. European Markets
The S&P 500 and European markets are also moving in opposite directions.
The Dow Jones Europe index has encountered resistance and shows a breakdown in relative strength versus the global benchmark, confirming a relative downtrend.
Meanwhile, the S&P 500 has broken to new highs in relative strength, affirming its relative uptrend.
Key Takeaways
From an international perspective, the Hang Seng index and the S&P 500 exhibit positive rotations, while the Nifty 500 and European markets are on a negative trajectory.
It’s important to note that the strength of the S&P 500 does not guarantee its continued rise; it simply indicates that, at present, it is outperforming many other markets.
By analyzing relative strengths and rotations using Relative Rotation Graphs, investors can gain insights into where the markets may be heading vis-a-vis each other and make more informed decisions.
#StayAlert and have a great weekend, –Julius