Week Ahead: NIFTY May See Mild Rebounds; Painful Mean Reversion May Continue

The Indian benchmark Nifty 50 extended its corrective decline. Over the past four sessions of a truncated week, the Nifty 50 index remained largely under selling pressure. Throughout the past week, the markets continued with their process of mean-reversion. The volatility, though, did not show any major surge. The volatility gauge, IndiaVIX rose by a modest 2.11% to 14.77. The trading range over the past week stayed wider on the expected lines. The Nifty oscillated in a range of 852 points. It closed with a net weekly loss of (-615.50) points (-2.55%).
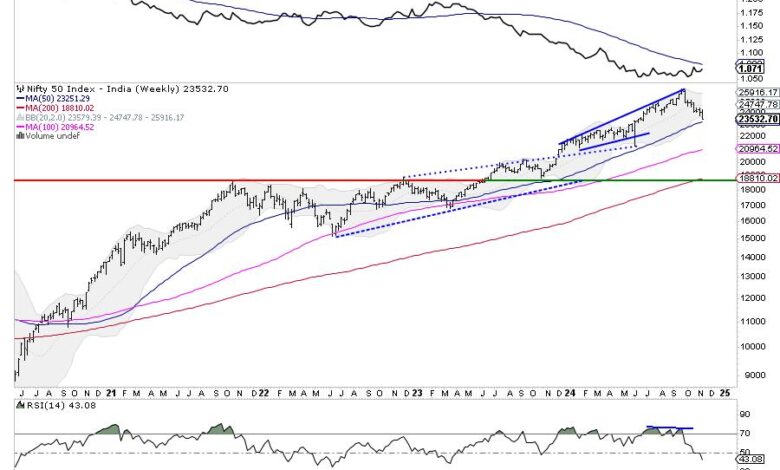
The coming week is truncated as well. Wednesday, November 20th is a trading holiday due to Assembly Elections in the state of Maharashtra. The markets are undergoing a painful mean-reversion process. As of now, though the Nifty has closed a notch below the 200-DMA which is currently placed at 23555, it has managed to defend this important support. Beyond this, the Nifty is within striking distance of the 50-week MA which presently stands at 23253. Even if the index ends up testing this level, the long-term primary uptrend would still stay intact. Two possibilities remain distinct; a relief rally in the form of a technical pullback cannot be ruled out; in the same breadth, the markets remain weak and vulnerable to extended corrective pressure.
On Monday, the Nifty will adjust to the global market setup as it will open after a gap of one day. The levels of 23650 and 23780 may act as potential resistance points. The supports come in at 23250 and 23000 levels.
The weekly RSI is 43.26; it has made a fresh 14-period low which is bearish. It also stays neutral and does not show any divergence against the price. The weekly MACD is bearish and stays below its signal line. The widening Histogram shows accelerated momentum during the downtrend. A long black body occurred on the Candles; this showed the strength of the trend on the downside.
The pattern analysis shows that the Nifty has made a feeble attempt to defend its 200-DMA though it has closed slightly below this important point. Any further downside may see the Index testing another important support level of 50-week MA which is placed at 23253. Besides this, the index has taken support on an extended trendline which also remains in close proximity to the 50-week MA.
All in all, the markets are trading with a weak undercurrent. A technical rebound and a relief rally cannot be ruled out; however, the markets are also vulnerable to sustained selling pressure and a test of lower levels cannot be ruled out. The market breadth remains weak and this is concerning as all technical rebounds may get sold if the breadth continues to remain weak. It is strongly recommended that all leveraged exposures must be curtailed. Any technical rebound; as and when it occurs, should not be chased and all gains must be mindfully protected. A highly cautious approach is advised for the coming week.
Sector Analysis for the coming week
In our look at Relative Rotation Graphs®, we compared various sectors against CNX500 (NIFTY 500 Index), which represents over 95% of the free float market cap of all the stocks listed.
Relative Rotation Graphs (RRG) show a largely unchanged sectoral setup. Nifty Services Sector, Pharma, Financial Services, and IT sector indices are inside the leading quadrant. They are likely to continue to relatively outperform the broader markets.
The Nifty Consumption, Midcap 100, and FMCG indices are inside the weakening quadrant. These sectors are expected to continue giving up on their relative performance over the coming weeks.
The Realty, Infrastructure, PSE, Media, Auto, Commodities, and Energy indices are inside the lagging quadrant. Among these, Commodities, Energy, Realty, and Infrastructure Indices are seen improving their relative momentum against the Nifty 500 index.
The Banknifty, PSU Bank, and Nifty Metal Indices are inside the improving quadrant. A gradual betterment in their relative performance can be expected over the coming weeks.
Important Note: RRG™ charts show the relative strength and momentum of a group of stocks. In the above Chart, they show relative performance against NIFTY500 Index (Broader Markets) and should not be used directly as buy or sell signals.
Milan Vaishnav, CMT, MSTA
Consulting Technical Analyst


