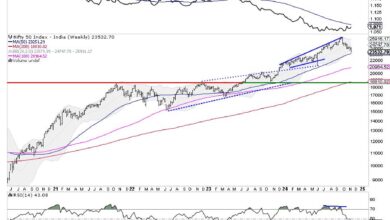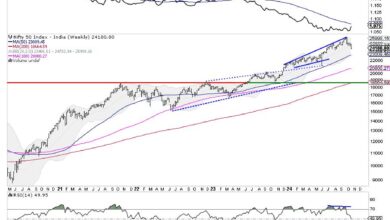
In today’s article and video we discuss the weakness that pervades nearly all index charts. Over the past few days many of the indexes have lost their PMO BUY Signals. Nearly all have crossed beneath their signal lines with the exception of the Nasdaq which is still holding above its signal line.
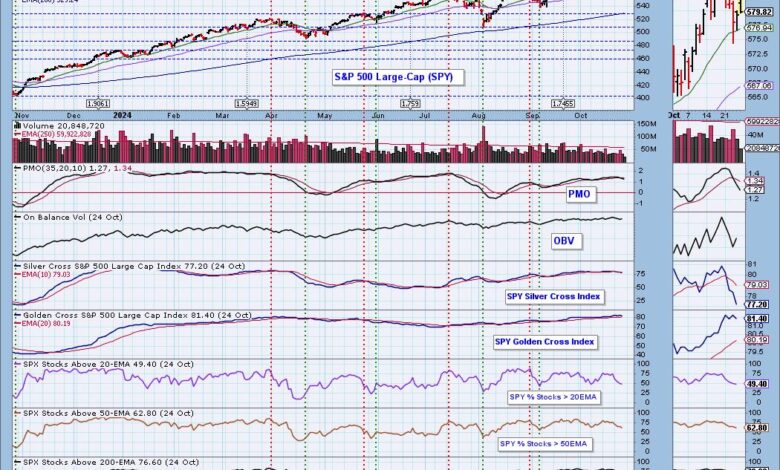
The SPY below shows the PMO Crossover SELL Signal but we also see participation of stocks above their key moving averages are trending lower. The Silver Cross Index is below its signal line giving us a BEARISH IT Bias.
The Nasdaq is the only index that still has the PMO holding above its signal line. This is due to the current rally, but that could fail based on the shooting star candlestick being formed on Friday morning. This could fail given we are seeing a bleed off from participation indicators. Admittedly, the Silver Cross Index looks bullish right now but given lower percentages of stocks above their 20/50-day EMAs, it should turn down shortly.
Let’s look at the mega-cap heavy indexes. All of these show the same PMO Crossover SELL Signals and bleeding participation. Most of the Silver Cross Indexes are in decline with some beneath the signal line.
Dow:
Nasdaq 100:
SP100:
Smaller-caps are being hit the hardest right now. They aren’t seeing upside reversals on Friday as some of the larger-cap indexes. If there is a place to hedge, small- and mid-cap indexes seem the best place given their weakness hasn’t subsided. The Silver Cross Indexes are all in decline and beneath their signal lines so all of the small- and mid-cap indexes and broader NYSE.
NYSE:
SP400:
SP600:
Conclusion: While many large-cap indexes are trying to reverse on Friday, internals are very weak especially given the PMO SELL Signals. While we could still see an upside reversal, momentum suggests it will take some time to reignite. In the meantime, participation needs to start seeing improvement rather than bleeding off as it is on all of the indexes. Small- and mid-caps are showing significant weakness and could be an opportunity to hedge your buy and hold positions. Below is a five minute video that details more of the weakness we see in these indexes.
Introducing the new Scan Alert System!
Delivered to your email box at the end of the market day. You’ll get the results of our proprietary scans that Erin uses to pick her “Diamonds in the Rough” for the DecisionPoint Diamonds Report. Get all of the results and see which ones you like best! Only $29/month! Or, use our free trial to try it out for two weeks using coupon code: DPTRIAL2. Click HERE to subscribe NOW!
Learn more about DecisionPoint.com:
Watch the latest episode of the DecisionPointTrading Room on DP’s YouTube channel here!
Try us out for two weeks with a trial subscription!
Use coupon code: DPTRIAL2 Subscribe HERE!
Technical Analysis is a windsock, not a crystal ball. –Carl Swenlin
(c) Copyright 2024 DecisionPoint.com
Disclaimer: This blog is for educational purposes only and should not be construed as financial advice. The ideas and strategies should never be used without first assessing your own personal and financial situation, or without consulting a financial professional. Any opinions expressed herein are solely those of the author, and do not in any way represent the views or opinions of any other person or entity.
DecisionPoint is not a registered investment advisor. Investment and trading decisions are solely your responsibility. DecisionPoint newsletters, blogs or website materials should NOT be interpreted as a recommendation or solicitation to buy or sell any security or to take any specific action.
Helpful DecisionPoint Links:
Price Momentum Oscillator (PMO)